Don't forget to complete your donation
complete your donation
← Back to Curriculum
Science
Field & Data
No more grades

Oyster Research Station Investigation

Unit
20+
Class Periods
2+
Field Visits
~$
38
in Materials
Students investigate the biology and ecology of oysters through hands-on research at their Oyster Research Station. Working with live oysters in a classroom tank or at a field site, students design and carry out investigations to understand how oysters grow, filter water, and build reef structures. The curriculum connects laboratory skills with real-world restoration science in New York Harbor.
Oyster Research Station Investigation 6-8

Overview

Core Practices

Observation
Data Collection
Inquiry
Comparison Over Time

What Students Do

  1. learn why oysters are keystone species in New York Harbor
  2. practice scientific observation, inference, and prediction
  3. prepare for fieldwork through classroom activities
  4. conduct two guided ORS field visits
  5. collect data on oysters and associated organisms
  6. analyze and summarize field observations
  7. develop and refine research questions
  8. compare ecosystem changes between visits

Pacing & Logistics

Classroom Preparation

Multiple lessons occur before the first field visit to build background knowledge and observation skills.

Field Visits

Students visit their Oyster Research Station twice during the investigation.

Typical visit duration: 1.5–2 hours per visit.

Visits may occur on the same day OR across multiple shorter visits depending on scheduling and site access.

Flexibility

Lessons may be adapted depending on your scheduling constraints, weather conditions, site access, and student pacing.

Field activities follow structured protocols but support student-led inquiry.

Field Visits
2+
CTLE Standards
No standards assigned to this unit, yet.

LESSONS

5

chapters

CHAPTER

1

:

Setting the Stage for your First ORS Visit

Classroom preparation building background knowledge on oysters as keystone species, scientific observation skills, and prediction-making before the first field visit.

Lesson

1

:

Oysters are a Keystone Species

Length
45 min.
Setting
Classroom
Subject
Science
Lesson Question
Why are oysters considered a keystone species in New York Harbor?
Lesson snapshot

Students explore the concept of keystone species and learn why oysters play a critical role in the health of New York Harbor's ecosystem, filtering water, building habitat, and supporting biodiversity.

Students will:
  • Define keystone species and explain its importance in an ecosystem.
  • Identify the ecological roles oysters play in New York Harbor.
  • Analyze how the decline of oysters has affected the harbor ecosystem.
Materials & Quick Links

Sign up to access lesson content

Create free teacher credentials to access full lesson plans, downloadable materials, and teaching resources for your classroom.

Lesson

2

:

Observation and Inference

Length
1 class period
Setting
Classroom
Subject
Science
Lesson Question
What is the difference between an observation and an inference?
Lesson snapshot

Students practice distinguishing between observations (what you directly see, hear, smell, touch) and inferences (conclusions drawn from observations), a foundational science skill needed for fieldwork.

Students will:

Distinguish between observations and inferences.

Practice making detailed observations using multiple senses.

Draw reasonable inferences from observations.

Materials & Quick Links
No materials available currently. Think this is a mistake? Let us know.

Sign up to access lesson content

Create free teacher credentials to access full lesson plans, downloadable materials, and teaching resources for your classroom.

Lesson

3

:

Observe Oyster Shell

Length
1 class period
Setting
Classroom
Subject
Science
Lesson Question
What can we learn by carefully observing an oyster shell?
Lesson snapshot

Students examine real oyster shells, making detailed observations about structure, texture, color, and signs of other organisms, building familiarity with what they'll encounter in the field.

Students will:

Make detailed scientific observations of oyster shells.

Identify key structural features of oyster shells.

Record observations using scientific sketching and descriptive language.

Materials & Quick Links
No materials available currently. Think this is a mistake? Let us know.

Sign up to access lesson content

Create free teacher credentials to access full lesson plans, downloadable materials, and teaching resources for your classroom.

Lesson

4

:

Other Organisms at Your ORS Site

Length
1 class period
Setting
Classroom
Subject
Science
Lesson Question
What other organisms might we find living on or near oysters at our research station?
Lesson snapshot

Students learn about the biodiversity associated with oyster reefs, including crabs, mussels, sea squirts, and algae, preparing them to identify and catalog organisms during their field visit.

Students will:

Identify common organisms found on oyster reefs.

Explain symbiotic relationships between oysters and associated species.

Create a field identification guide for their ORS visit.

Materials & Quick Links
No materials available currently. Think this is a mistake? Let us know.

Sign up to access lesson content

Create free teacher credentials to access full lesson plans, downloadable materials, and teaching resources for your classroom.

Lesson

5

:

Make and Refine Predictions about your ORS Site

Length
1 class period
Setting
Classroom
Subject
Science
Lesson Question
What do you predict you will observe at your Oyster Research Station?
Lesson snapshot

Students synthesize their classroom learning to make evidence-based predictions about what they will find at their ORS site, including oyster size, biodiversity, and water conditions.

Students will:

Formulate evidence-based predictions about their ORS site.

Explain the reasoning behind each prediction.

Design a simple data collection plan for their first field visit.

Materials & Quick Links
No materials available currently. Think this is a mistake? Let us know.

Sign up to access lesson content

Create free teacher credentials to access full lesson plans, downloadable materials, and teaching resources for your classroom.

CHAPTER

2

:

Your First ORS Field Visit

Students conduct their first guided visit to an Oyster Research Station, collecting baseline data on oyster growth and associated organisms.

Lesson

1

:

Preparing for Your First ORS Field Visit

Length
1 class period
Setting
Classroom
Subject
Science
Lesson Question
How do we prepare for a successful field investigation?
Lesson snapshot

Students review field protocols, safety procedures, and data collection methods in preparation for their first visit to an Oyster Research Station.

Students will:
  • Review ORS field protocols and data collection sheets.
  • Practice safety procedures for waterfront fieldwork.
  • Assign team roles for data collection stations.
  • Preview the site layout and plan their approach.
Materials & Quick Links
No materials available currently. Think this is a mistake? Let us know.

Sign up to access lesson content

Create free teacher credentials to access full lesson plans, downloadable materials, and teaching resources for your classroom.

Lesson

2

:

ORS Field Visit 1: Collecting Baseline Data

Length
1.5-2 hours
Setting
Field
Subject
Science
Lesson Question
What is the current state of our Oyster Research Station?
Lesson snapshot

Students visit their ORS for the first time, measuring oyster size, counting organisms, recording water conditions, and documenting their observations through sketches and data sheets.

Students will:
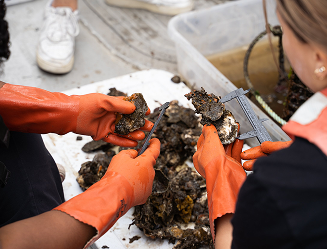
  • Measure oyster shell height and width using calipers.
  • Count and identify organisms living on the ORS cage.
  • Record water quality observations (clarity, temperature, salinity).
  • Sketch the research station site and surrounding environment.
  • Document observations in their field notebooks.
Materials & Quick Links
No materials available currently. Think this is a mistake? Let us know.

Sign up to access lesson content

Create free teacher credentials to access full lesson plans, downloadable materials, and teaching resources for your classroom.

Lesson

3

:

Debrief: Reflecting on Field Visit 1

Length
1 class period
Setting
Classroom
Subject
Science
Lesson Question
What surprised you about your first ORS visit?
Lesson snapshot

Students share observations, compare findings across groups, and reflect on what went well and what could improve in their data collection methods.

Students will:
  • Share initial observations and surprises from the field visit.
  • Compare findings across different data collection groups.
  • Evaluate what went well and what to improve in their methods.
  • Identify preliminary patterns in the data they collected.
Materials & Quick Links
No materials available currently. Think this is a mistake? Let us know.

Sign up to access lesson content

Create free teacher credentials to access full lesson plans, downloadable materials, and teaching resources for your classroom.

CHAPTER

3

:

Analyzing Your First Visit Data

Back in the classroom, students organize, analyze, and summarize the data collected during their first ORS field visit.

Lesson

1

:

Organizing and Graphing Your Data

Length
1-2 class periods
Setting
Classroom
Subject
Math
Lesson Question
How do we organize field data to reveal patterns?
Lesson snapshot

Students input their field data into tables and create graphs to visualize oyster measurements, organism counts, and water quality readings from their first visit.

Students will:
  • Enter field data into organized tables and spreadsheets.
  • Create bar graphs of oyster measurements and organism counts.
  • Plot water quality readings on line graphs.
  • Label graphs with appropriate titles, axes, and units.
Materials & Quick Links
No materials available currently. Think this is a mistake? Let us know.

Sign up to access lesson content

Create free teacher credentials to access full lesson plans, downloadable materials, and teaching resources for your classroom.

Lesson

2

:

Analyzing Patterns in Your ORS Data

Length
1 class period
Setting
Classroom
Subject
Science
Lesson Question
What patterns can we find in our data?
Lesson snapshot

Students analyze their graphs and data tables to identify trends, outliers, and patterns in oyster growth and biodiversity at their research station.

Students will:
  • Identify trends and outliers in their graphed data.
  • Compare their station's results with other groups or citywide data.
  • Form evidence-based explanations for observed patterns.
  • Generate questions for further investigation at their next visit.
Materials & Quick Links
No materials available currently. Think this is a mistake? Let us know.

Sign up to access lesson content

Create free teacher credentials to access full lesson plans, downloadable materials, and teaching resources for your classroom.

CHAPTER

4

:

Your Second ORS Field Visit

Students return to their Oyster Research Station to collect comparison data, observing changes in oyster growth and ecosystem over time.

Lesson

1

:

Preparing for Your Second ORS Visit

Length
45+ min.
Setting
Classroom
Subject
Science
Lesson Question
What questions do you want to investigate during your second visit?
Lesson snapshot

Students develop focused research questions based on their first visit data, refine prediction skills, and plan targeted data collection for their return trip.

Students will:
  • Develop focused research questions based on Visit 1 data.
  • Make predictions about how the station may have changed.
  • Plan targeted data collection strategies for their return trip.
  • Review and refine their field protocols.
Materials & Quick Links
No materials available currently. Think this is a mistake? Let us know.

Sign up to access lesson content

Create free teacher credentials to access full lesson plans, downloadable materials, and teaching resources for your classroom.

Lesson

2

:

ORS Field Visit 2: Comparison Data Collection

Length
1.5-2 hours
Setting
Field
Subject
Science
Lesson Question
How has our Oyster Research Station changed since our first visit?
Lesson snapshot

Students return to their ORS to collect comparison data using the same protocols, noting changes in oyster growth, biodiversity, water conditions, and site appearance.

Students will:
  • Collect comparison measurements of oyster growth.
  • Record changes in biodiversity and organism populations.
  • Note differences in water quality and site conditions.
  • Document changes through sketches and photographs.
Materials & Quick Links
No materials available currently. Think this is a mistake? Let us know.

Sign up to access lesson content

Create free teacher credentials to access full lesson plans, downloadable materials, and teaching resources for your classroom.

Lesson

3

:

Debrief: Reflecting on Field Visit 2

Length
1 class period
Setting
Classroom
Subject
Science
Lesson Question
What changes did you notice between your two ORS visits?
Lesson snapshot

Students share initial observations about changes between visits and begin identifying which of their predictions were supported by the data.

Students will:
  • Share observations about changes between the two visits.
  • Evaluate which predictions were supported by the data.
  • Discuss possible explanations for unexpected findings.
  • Identify environmental factors that may have caused changes.
Materials & Quick Links
No materials available currently. Think this is a mistake? Let us know.

Sign up to access lesson content

Create free teacher credentials to access full lesson plans, downloadable materials, and teaching resources for your classroom.

CHAPTER

5

:

Comparing Ecosystem Changes Over Time

Students compare data from both visits, develop research questions, and draw conclusions about ecosystem change over time.

Lesson

1

:

Comparing Data Across Visits

Length
1-2 class periods
Setting
Classroom
Subject
Math
Lesson Question
What does our data tell us about ecosystem change over time?
Lesson snapshot

Students create side-by-side comparisons of their Visit 1 and Visit 2 data, calculating growth rates, population changes, and environmental shifts.

Students will:
  • Create side-by-side comparisons of Visit 1 and Visit 2 data.
  • Calculate growth rates and population changes over time.
  • Identify which environmental variables changed the most.
  • Use evidence to support or revise their original hypotheses.
Materials & Quick Links
No materials available currently. Think this is a mistake? Let us know.

Sign up to access lesson content

Create free teacher credentials to access full lesson plans, downloadable materials, and teaching resources for your classroom.

Lesson

2

:

Drawing Conclusions and Developing New Questions

Length
1-2 class periods
Setting
Classroom
Subject
Science
Lesson Question
What conclusions can we draw, and what new questions emerge from our investigation?
Lesson snapshot

Students synthesize their findings into evidence-based conclusions about oyster restoration and ecosystem health, then develop new research questions for future investigations.

Students will:
  • Synthesize findings into evidence-based conclusions.
  • Present key discoveries about oyster restoration and ecosystem health.
  • Develop new research questions for future investigations.
  • Reflect on their growth as field scientists throughout the unit.
Materials & Quick Links
No materials available currently. Think this is a mistake? Let us know.

Sign up to access lesson content

Create free teacher credentials to access full lesson plans, downloadable materials, and teaching resources for your classroom.